

Article Building Engineering Teams
Technical assessment ROI meta-analysis: 18 programs with measurable returns

In short
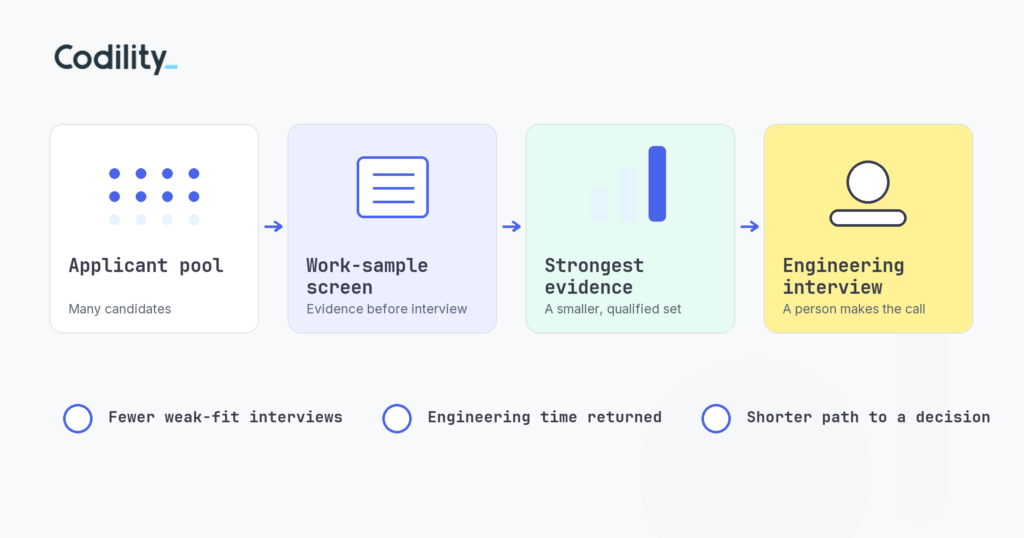
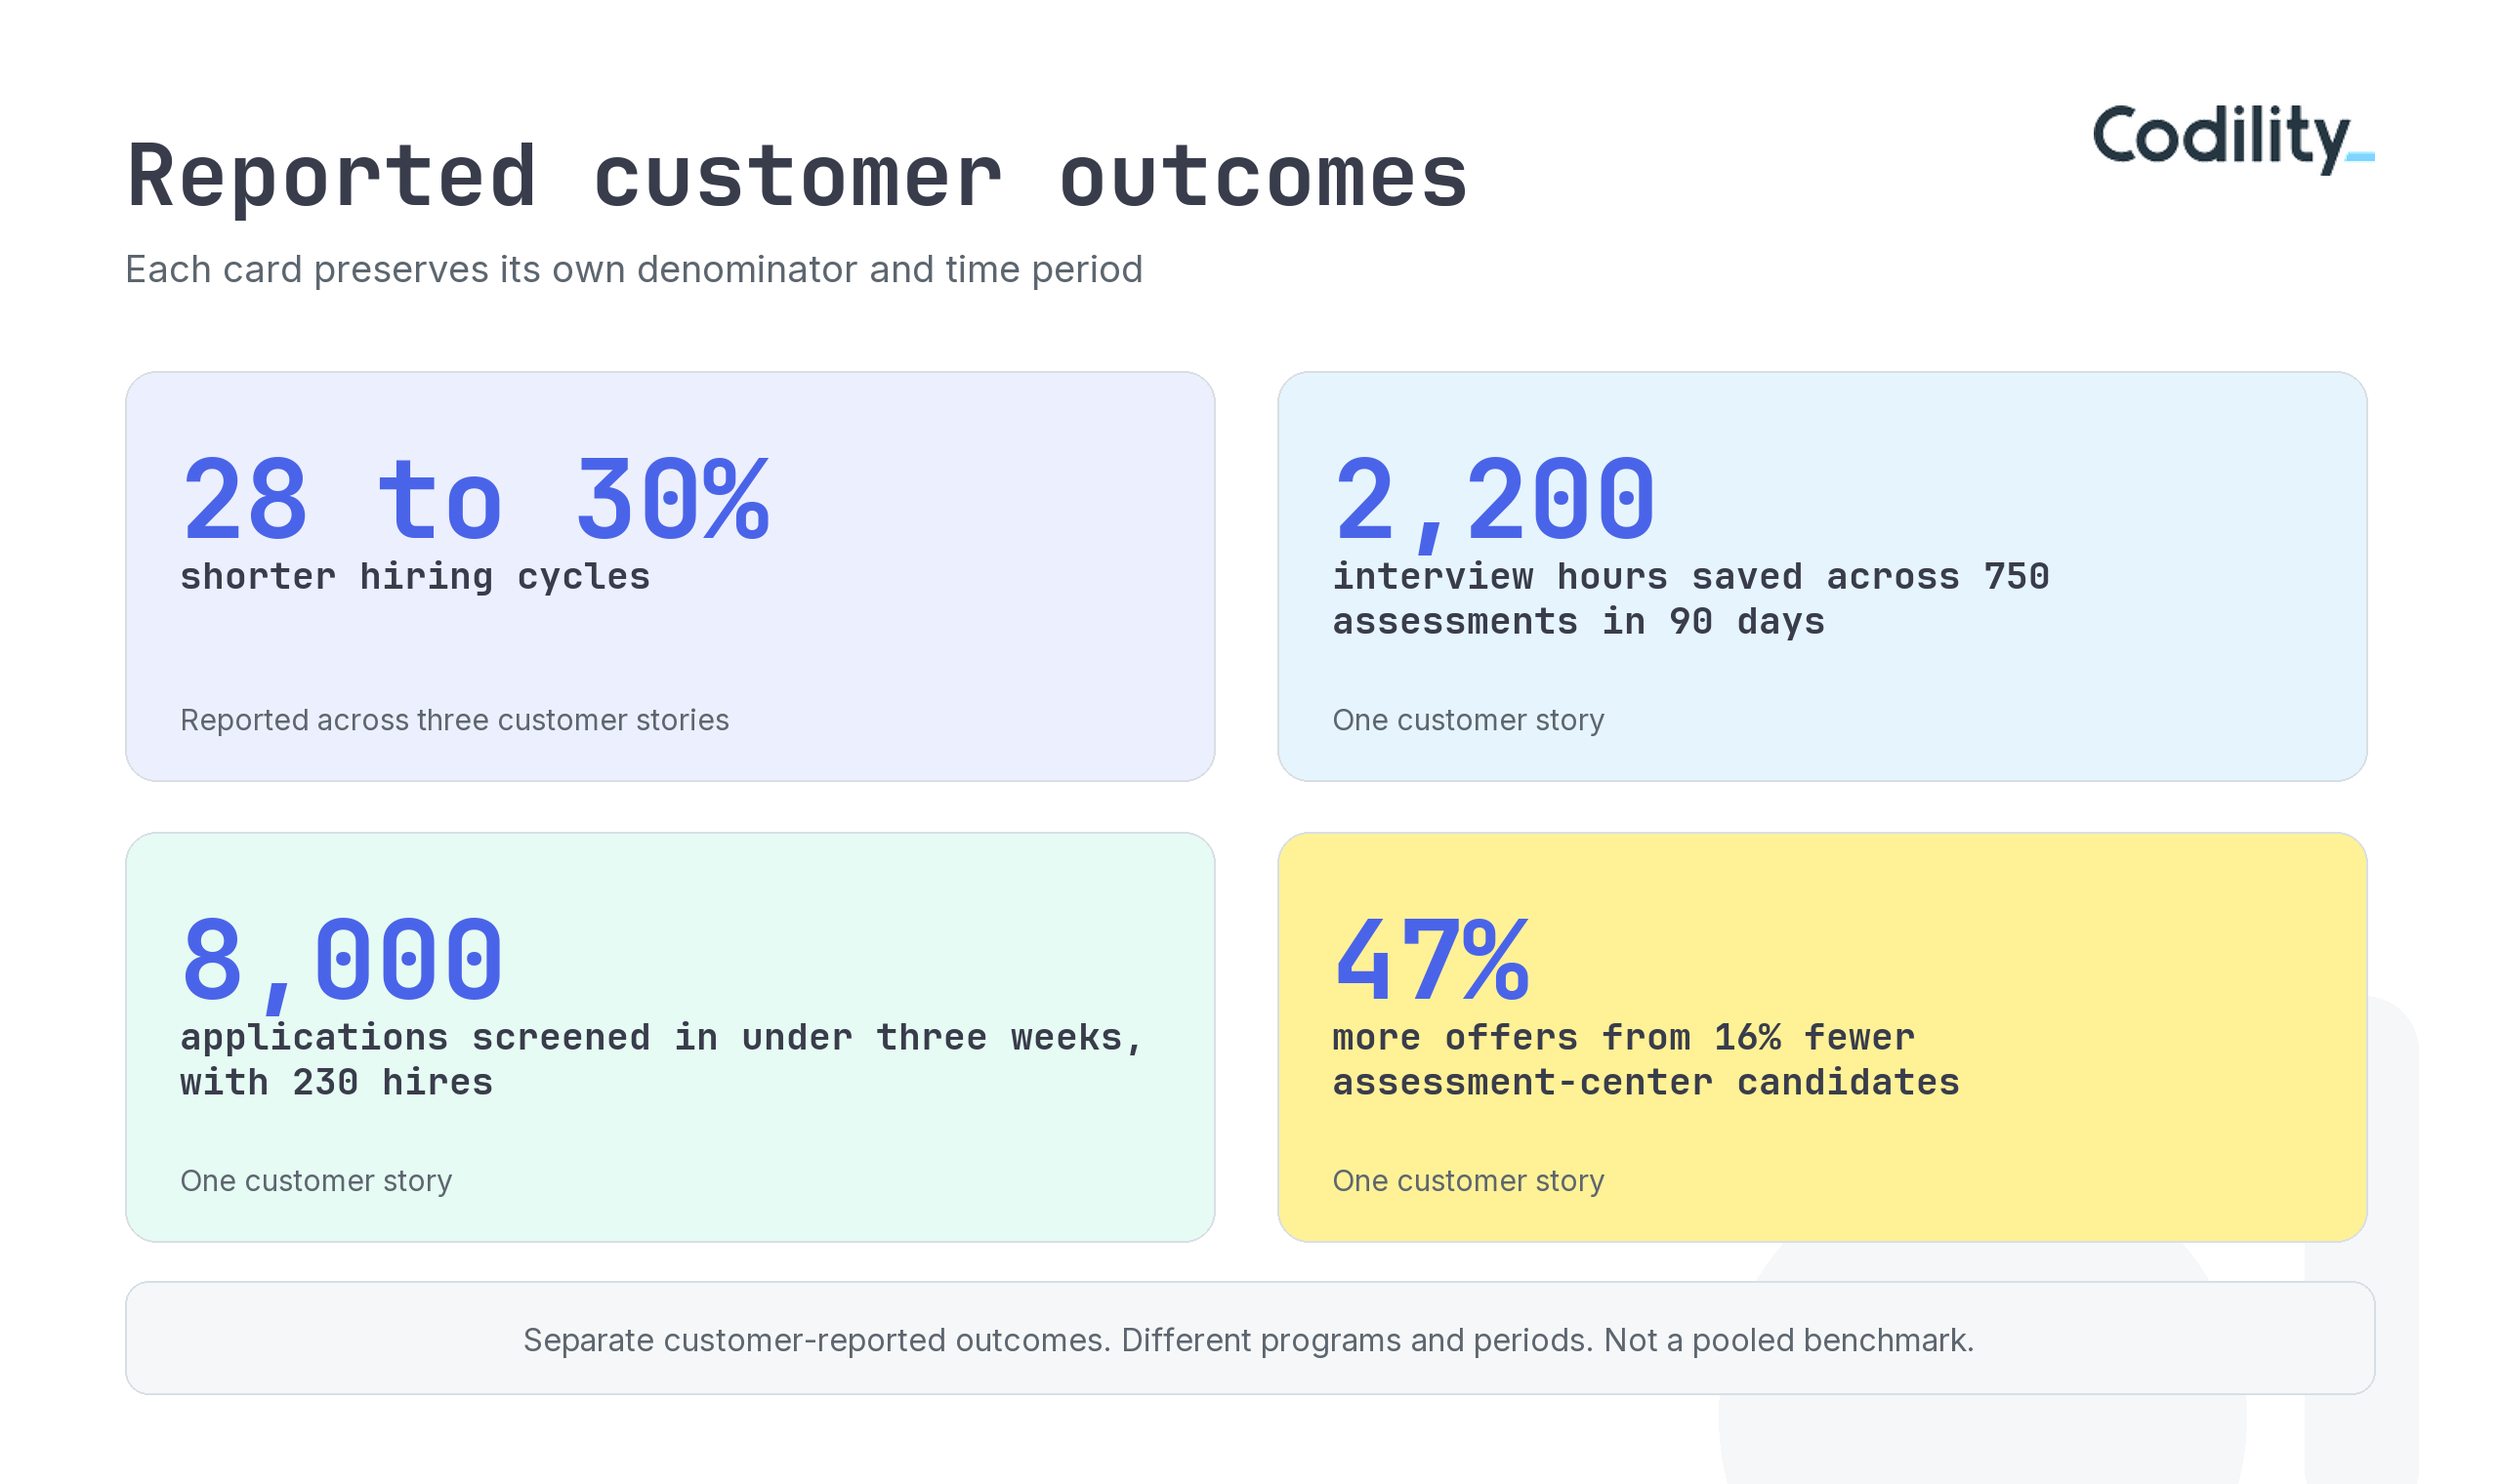
A technical assessment ROI meta-analysis of 18 customer programs shows four operating returns: fewer engineering interview hours, shorter hiring cycles, more screening capacity, and stronger funnel conversion. Three programs reported roughly 28 to 30 percent shorter hiring cycles. One reported 2,200 interview hours saved.
- Three programs reported hiring-cycle reductions of 28 percent, over 30 percent, and 30 percent after changing their technical assessment process.
- One program reported 2,200 interview hours saved across 750 assessments in 90 days. Another reported more than 1,000 interviewer hours saved after filtering 65 percent of candidates before interview.
- High-volume programs reported screening more than 8,000 applications in under three weeks, processing more than 4,000 graduate applications across five offices, and assessing 26,000 candidates.
- One early-career program reported 47 percent more offers from 16 percent fewer assessment-center candidates, with 90 percent assessment completion.
- The source set uses customer-reported outcomes from different programs and periods. Each program shows its own operating return, with no single ROI percentage across the set.
How does this technical assessment ROI meta-analysis work?
I reviewed 18 customer programs across financial services, software, telecommunications, retail, gaming, public-sector hiring, and early-career recruitment. Some covered a single campaign. Others described an operating model across regions.
I use meta-analysis here as a structured comparison across a body of evidence. Because the programs use different denominators, periods, and funnel designs, I kept every result attached to its original context. The article reports program-specific patterns and keeps each number separate.
The sources are customer evidence with observational results. I use them to identify patterns, then test those patterns against the customer’s own baseline. Here, ROI means operating return: time returned to engineering teams, a shorter path to a decision, more top-of-funnel capacity, and stronger downstream conversion.
For a financial utility model, see Codility’s technical assessment ROI model. This analysis uses reported customer outcomes. The financial model handles platform costs and dollar conversions.
Where does technical assessment ROI show up first?
I found the earliest, clearest return in engineering time: fewer hours spent interviewing candidates before they show the required skills.
One program ran 750 assessments in 90 days and reported saving three engineering hours per assessment, or more than 2,200 interview hours across departments. Another software services company reported filtering 65 percent of candidates before interview and saving more than 1,000 interviewer hours. A global financial software company reported that engineering time in recruitment fell by 50 percent after moving from manually created and reviewed tests to an online assessment workflow.
The logic is operational. Five engineers in a one-hour panel consume five engineering hours, before preparation, feedback, and scheduling. A short work simulation earlier in the process changes who reaches that panel.
I’d measure this directly. Start with interviewer hours per hire, separated into screening calls, technical interviews, panels, preparation, and feedback. Compare the baseline with the same role family after the assessment enters the process.
How much can the hiring cycle move?
I found three reported reductions: 28 percent, over 30 percent, and 30 percent.
One early-career program reduced its path to final interview from six weeks to four while handling more than 3,000 applications. A financial software company reported a 28 percent reduction in time-to-hire over six months. A gaming company reported a 30 percent reduction in two regions, moving from 100 days to roughly 70 to 80 in one market and from 60 to 70 days to roughly 40 to 50 in another.
Three observations support a directional claim. The largest gains appeared where the old process depended on manual test creation, manual scoring, scheduling, or an engineer-led screen before verified skills evidence existed. I’d use the pattern to form a hypothesis, then test it against the customer’s own baseline.
How does technical assessment scale hiring?
I see scale as capacity. The strongest examples show how many applications a program can process while keeping assessment and interview stages distinct.
One graduate program screened more than 8,000 applications in under three weeks and hired 230 people. Another received more than 4,000 graduate applications, sent nearly 800 assessments automatically, and rolled the process out across five offices. A large technology retailer received 5,400 engineering applications, assessed and interviewed more than 500 candidates, and hired 132 people.
These figures describe different funnels, so I’d report them separately. The repeatable pattern is capacity: a structured assessment handles more early volume, while engineering teams spend more time on candidates who have already shown relevant skills. A separate review-effort measure will show whether manual work stayed flat.
I’d also judge a high-volume screen by whom it preserves and by the quality of the next stage. The assessment should create a manageable shortlist while keeping human judgment in the decision.
Can technical assessment improve funnel conversion?
I found examples where faster assessment and stronger downstream conversion appeared together. I read the evidence as correlational, with causation still an open question.
One campaign reported 90 percent assessment completion, 47 percent more offers from 16 percent fewer assessment-center candidates, and 55 percent more hires than the previous campaign. Another internship program narrowed more than 1,600 applicants to 24 interns and converted 23 of them to full-time roles. A third reported that more than 85 percent of offers were accepted before the end of the season.
These are funnel and retention proxies. I’d treat them as evidence that the teams built a faster process while preserving the downstream measures they cared about. Causation remains an open question.
I’d keep completion and candidate fairness in the same scorecard. Speed is useful when candidates can complete the process and understand its relevance.
Which metrics make technical assessment ROI defensible?
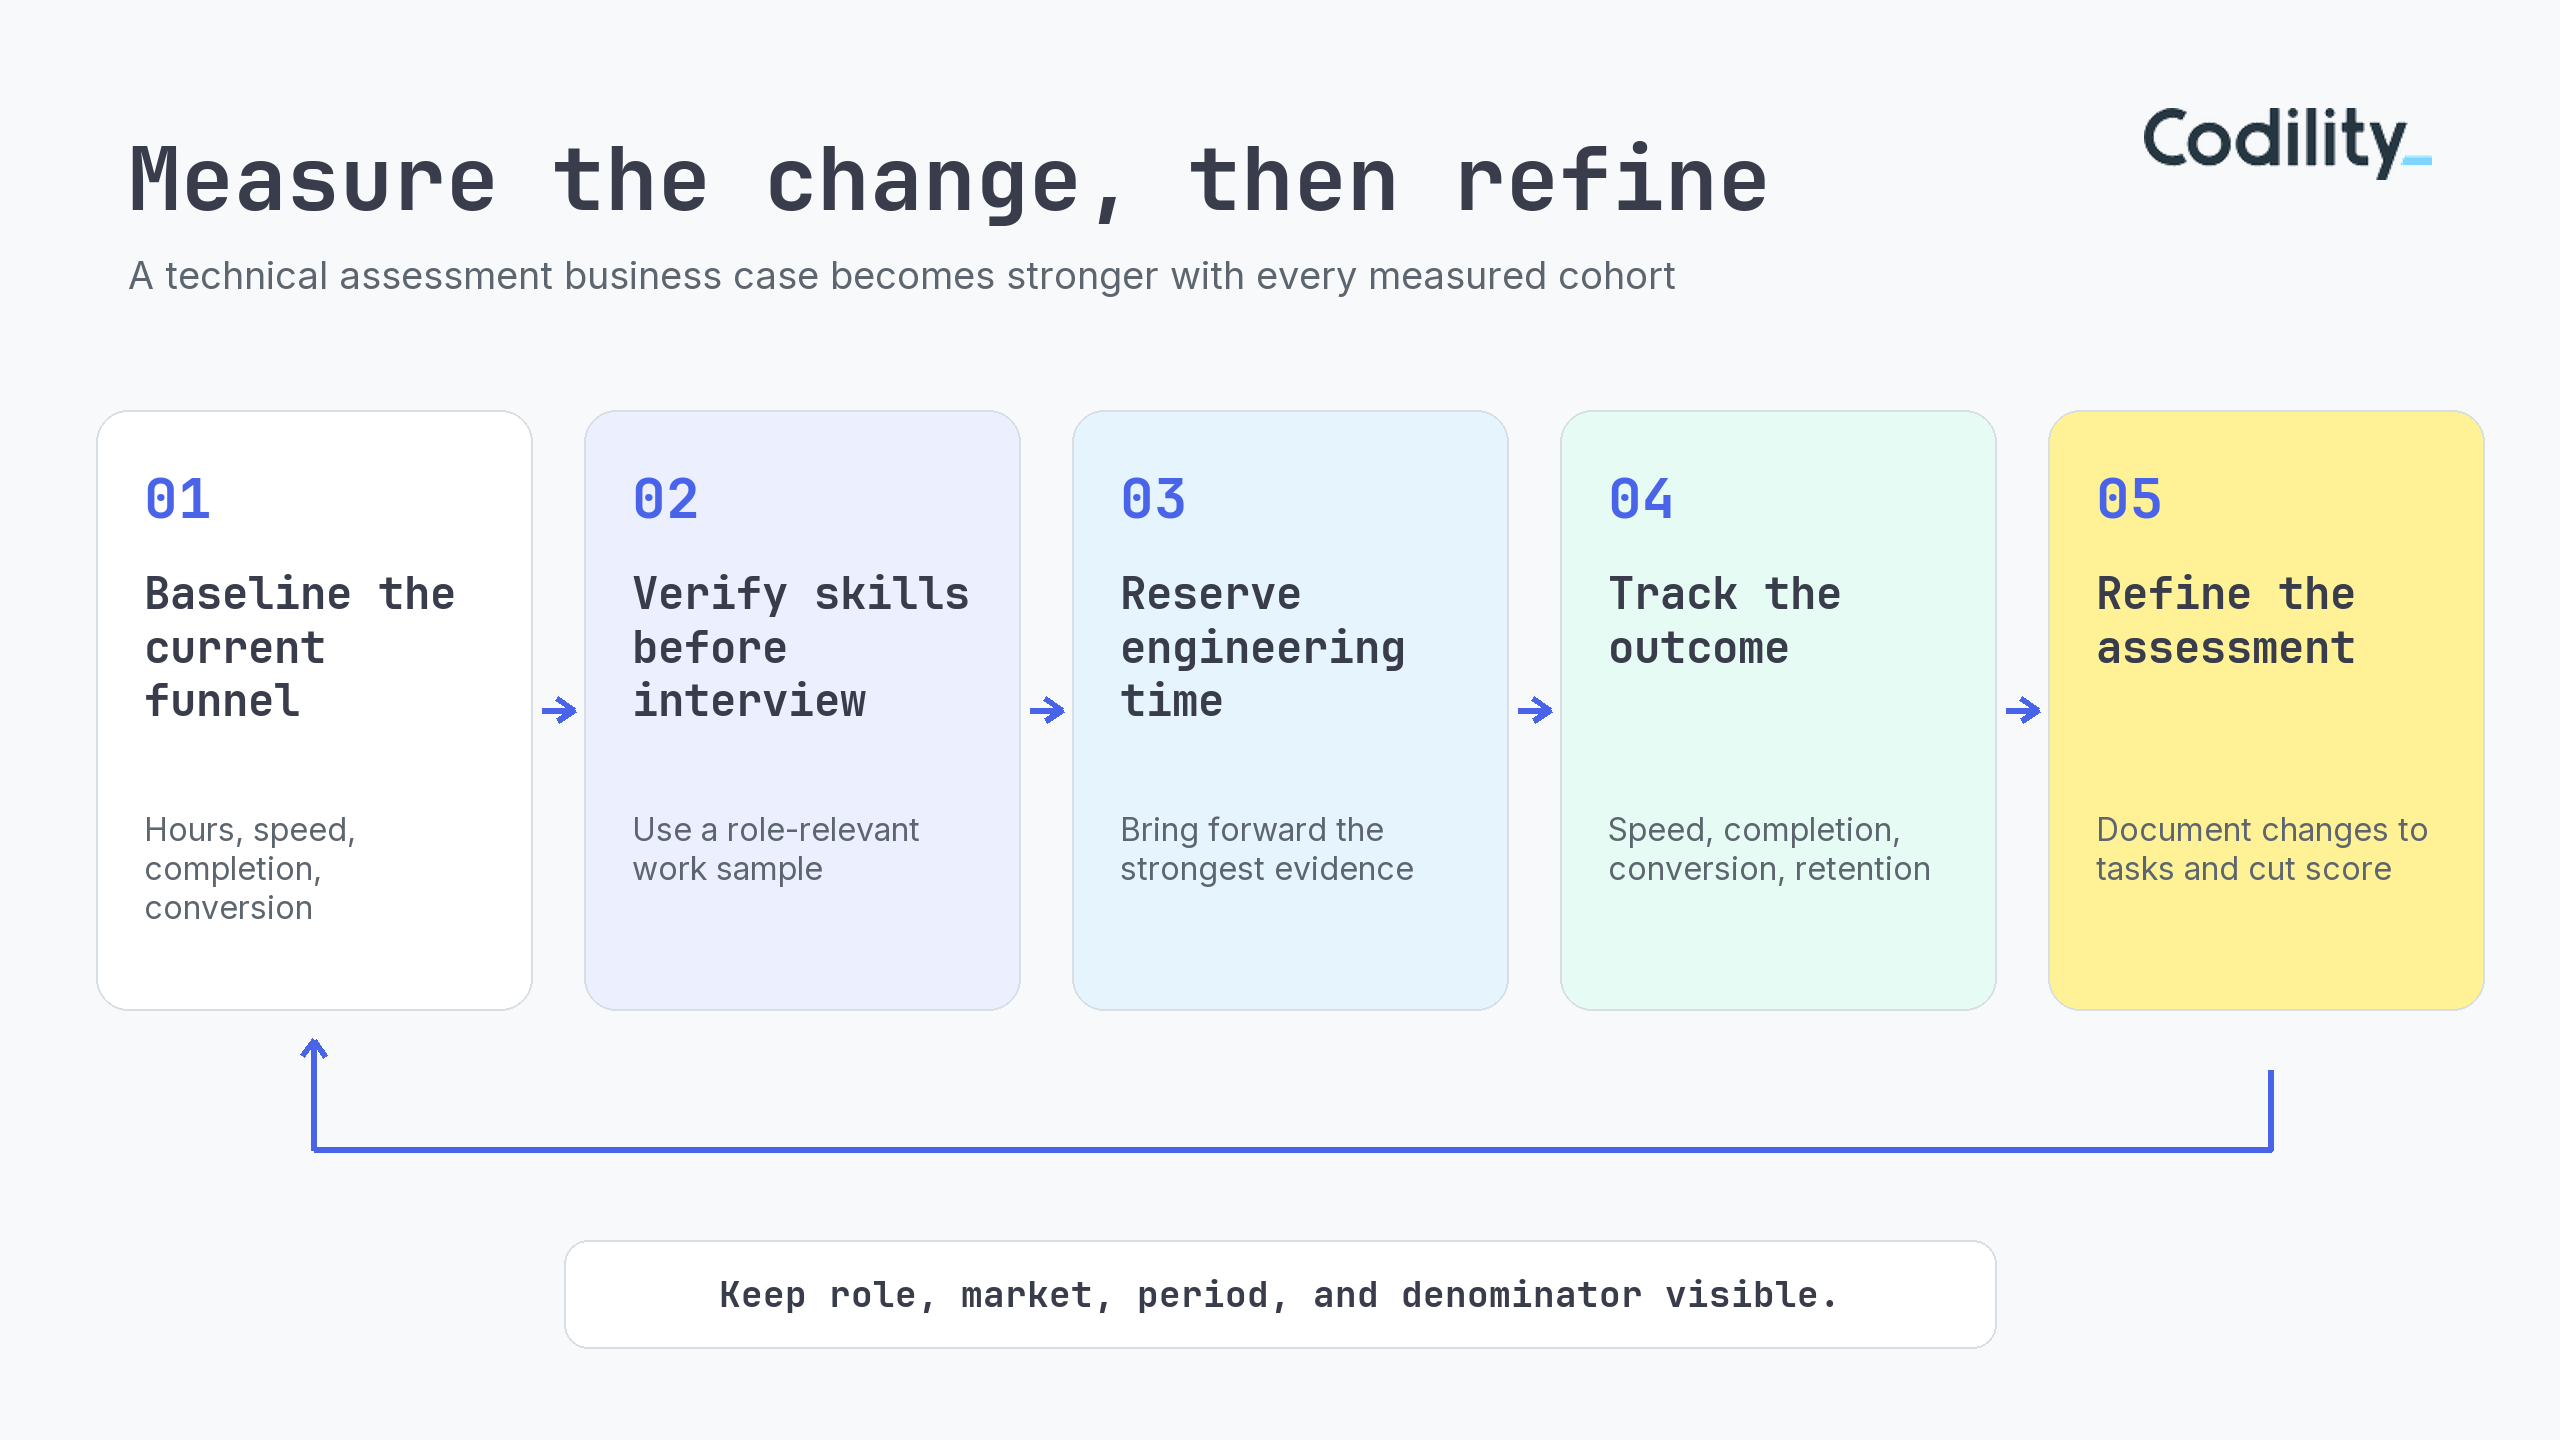
I’d use a small set of metrics that follow the funnel from operating effort to hiring outcome.
| Measure | Baseline | After implementation | Why it matters |
|---|---|---|---|
| Engineering interview hours per hire | Hours across screens, interviews, panels, preparation, and feedback | The same hours for the same role family | Direct opportunity cost returned to product work |
| Time to first verified skill signal | Application to completed work sample | The same interval after launch | Shows whether manual setup and scheduling were removed |
| Time-to-hire | Application to accepted offer | Compared by role and market | Captures the whole funnel, with local hiring conditions visible |
| Assessment start and completion | Invited, started, completed | Split by role and candidate group | Exposes friction or an assessment that is too long |
| Interview conversion | Assessed to interviewed to offered to hired | Compared with the prior cohort | Tests whether engineering time is reaching stronger candidates |
| Early retention or performance | First-quarter exits and agreed performance measures | Tracked by cohort over time | Moves the case from efficiency toward quality |
The order matters. Interview hours and time to first signal move quickly and are easy to audit. Offer conversion needs a full campaign. Retention and performance take longer and require the customer to connect assessment data with hiring outcomes.
I’d keep the claim hierarchy clear. Time saved is an observed operating result. A better conversion rate is a funnel result. Retention is influenced by many things after assessment. Calling all three direct product ROI weakens the case when a finance reviewer asks what was actually measured.
These measures complement the financial utility model described above. It converts validity and productivity assumptions into a gross return. This analysis stays with customer-reported operating results.
Where should a company start measuring technical assessment ROI?
I would start one stage before the most expensive human interaction.
Map the current process, count every engineering hour it consumes, and find the first point where verified work evidence could replace a CV judgment or a technical phone screen. Run the same assessment model for one role family or campaign. Keep the market, time period, candidate level, and denominator visible. Then compare hours, speed, completion, and conversion with the baseline.
The case studies vary in age and format. They point to the same operating choice: put a structured work sample before the interview, then preserve human judgment for the smaller set of candidates whose evidence is worth the time.
Once the engineering hours, hiring days, and conversion points are visible, technical assessment ROI stops being abstract.
About the author
Christopher Greco is Head of Product Marketing at Codility, where he owns how the platform is positioned across Screen, Interview and Skills Intelligence, and works alongside the Assessment Science team behind the Engineering Skills Model. He came to hiring from the other side of the AI question: before Codility he led product marketing for AI data and model evaluation at Toloka, serving frontier AI labs and large technology companies. He has also built marketing teams from nothing three times, so the hiring problems he writes about are ones he has had himself. He is based in Rome.
Frequently asked questions
How does technical assessment create ROI?
Technical assessment creates ROI by moving verified skills evidence ahead of expensive human review. That can return engineering time, shorten hiring cycles, increase screening capacity, and improve downstream conversion.